
Concept and Overview
The progression and development of my website A Tour of South Australia, from a very basic start to its final product has been challenging yet rewarding. Originally designed to serve as a paradigm aimed to hold and build upon a database of photos and locations, showing off South Australia; to what it is now, a fixed site tagged with the coordinates of each location as well as containing a simple tag to describe it. Through criticism both constructive and un-constructive, I learnt that my potential scope for the audience was vastly broad and as a result it has been refined, in coordination with the rest of the site. Now the audience scope focus’ more so on the active youth that already live in South Australia; rather than all ages, tourists and locals. This allows my website to stand out from the rest, being advertised on Instagram on both my personal and Digital Platforms social media accounts. While this may not seem significant, I have linked the posts to the websites, meaning those who interact with it will be brought to the site; allowing them to interact with it themselves.
Visual Communication and Design
The design and look that I have gone for in A Tour of South Australia is a minimalist, calming and straight forward, helping the build upon the aesthetic and overall emotional feel of the site (Tavakol, 2007). This helps to let the viewer interoperate the site and most importantly the images of their chosen location as they will, without having another’s bias (through the form of descriptive descriptions to shape their view. As John Berger stated in his article Understanding a photograph, ‘A photograph is already a message about the event it records.’ (Berger, 1972). In this quote Berger details how a photograph is in itself a message about the event that it records, however I have interoperated this slightly different in the sense that a photograph does not have to foretell an event as such; in this case it has the power to entice the viewer to visit the location.
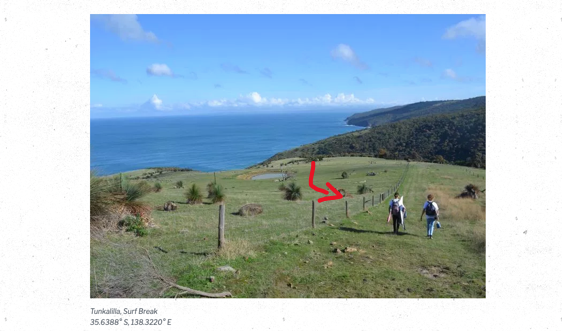
Aside from the aforementioned design, the main visual communication used is photography; the use of many differing techniques helped me to showcase and portray the chosen locations in the best way I could. With most of these photos a wide-angle lens was used in order to capture as much of the location as I could; while most of the images are landscapes this type of photography is fitting. Depending on the time of day, the light composition and the type of locating I was capturing, required different combination of camera settings. For example, the image below was shot on a Sony a6000 during broad sunlight with an aperture of f/3.4 and shutter speed of 2500.
User Interface Design
Poor interface design and functionality is the biggest potential cause of lack of user interest, which is why it is essential a website is designed with user satisfaction in mind (Hausman & Siekpe, 2009). Serving as the biggest detriment to website success and usability, the importance of a clear and easy to use categorisation within the site is imperative. With this in mind, a fixed and large navigation bar, spanning across the whole page was used and labelled with the headings of; Preface, The Journey and About Us. These three self-explanatory headings allow the user to filter through the site without detracting from the purpose of visiting in the first place; to view the photography and be inspired to travel to the chosen places.
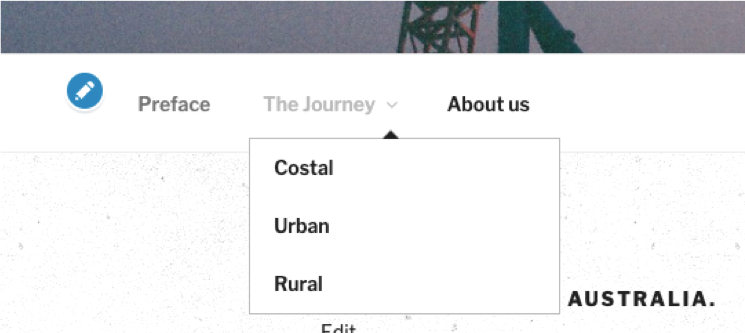
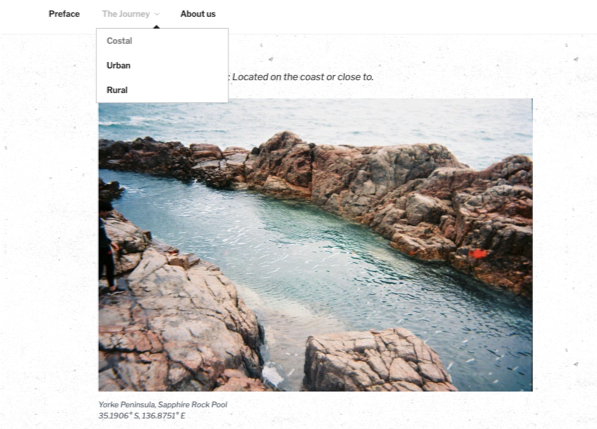
Inside ‘The Journey’, and sticking with the created tag line of ‘Come along with me’; the three highlighted geographical locations of Costal Urban and Rural. Once a user clicks on one of the three headings and or the sub headings under The Journey, they will be taken to a page within the site that is clear and concise. Only highlighting relevant and specific information to that heading. Under the Costal menu, all of the beachside photos will be uploaded. Below in the example is a picturesque rockpool found in York Peninsula.
The homepage, a simple and welcoming theme was used. Holding a gallery of all of the photos currently on the website, with a simple caption as utilised in a welcoming manner; briefly showcasing the overall feel for the website, a calming and straight forward design.
User Experience design across Digital Platforms
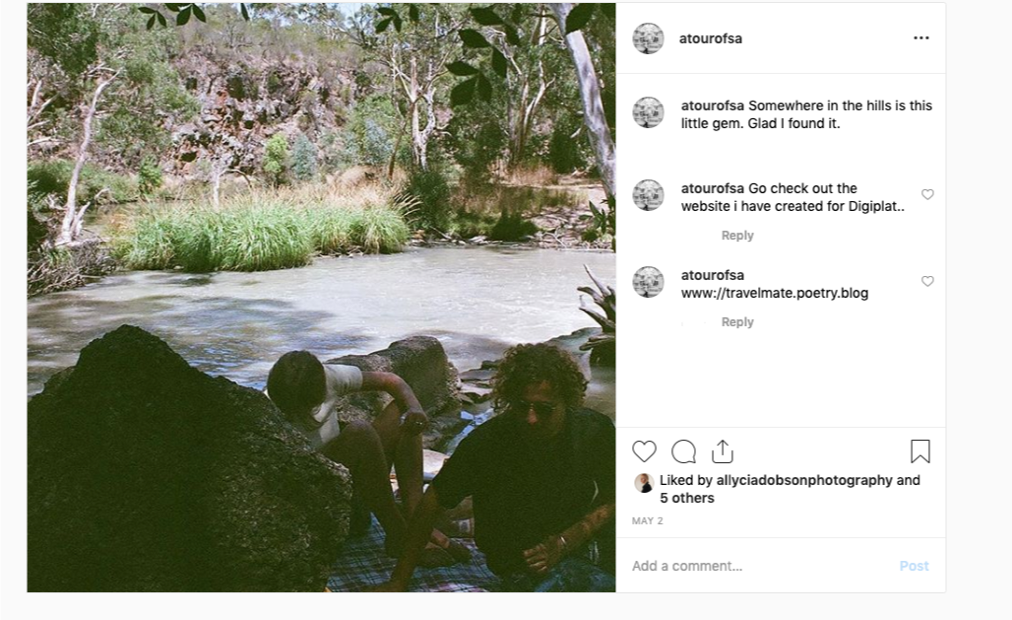
Now with instant accessibility, the use of social media in the modern age gives another avenue to help increase engagement and advertisement for the website (Cohen & Kenny, 2015). With this in mind, an Instagram and Twitter Account were created with the sole purpose of promoting this website. In the short scope given to create a functioning website and produce an analysis in the form of a report, the advertising social media accounts combined gained over 29 new followers. Most of the posts made follow the same look and feel and are often the same photo, this was done in order to gain different reactions, comments and perspectives; as the photos or posts would be exposed to different audiences on the different accounts.
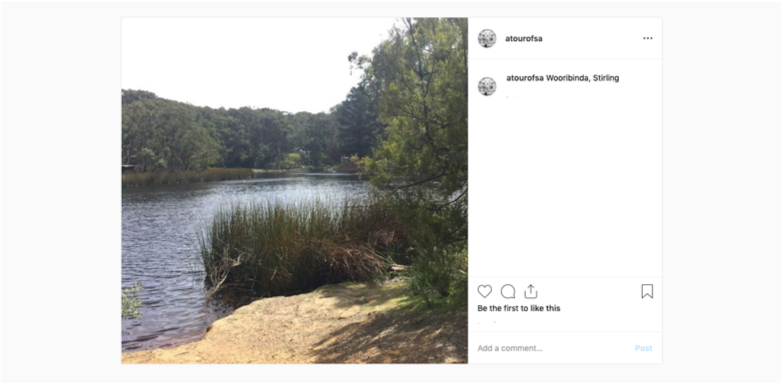
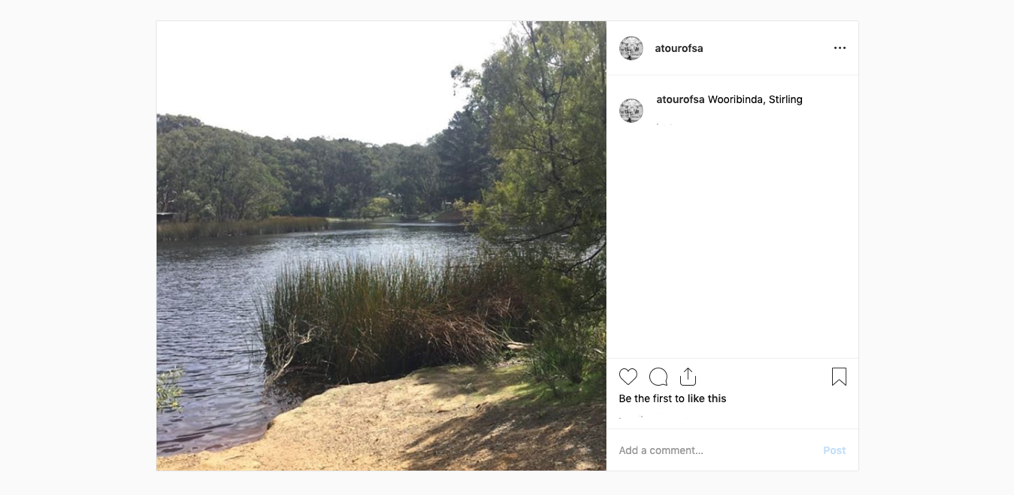
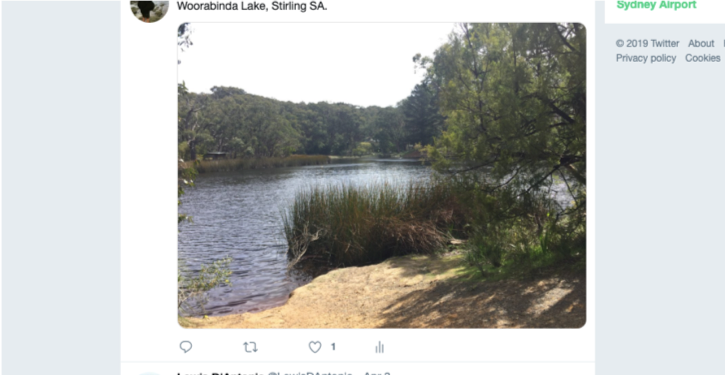
Above are an example of a photo used on A Tour of South Australia posted on both Instagram and twitter. As the aforementioned motif for posting the same photo on multiple platforms is to reach as many social media users as possible; this will help with the overall broadening the potential audience and allowing more people to view and benefit from this site. This eliminates the possibility of people not seeing the post and not knowing that it is not on the website. The more attention drawn to the photo and location; whether on Twitter, Instagram or Facebook, the more activity the site will gain.
Audience Metrics
Audience metrics provide pivotal information that helps to alter and increase user experience (Ebster, 2018). This pivotal information serves as an indicator for improvements or alterations that in turn will help gain more engagement and a steady growth rate (Poecze, 2019). It was found that there were less overall impressions then first thought; with an overall impression count across all three platforms concluded at 251.
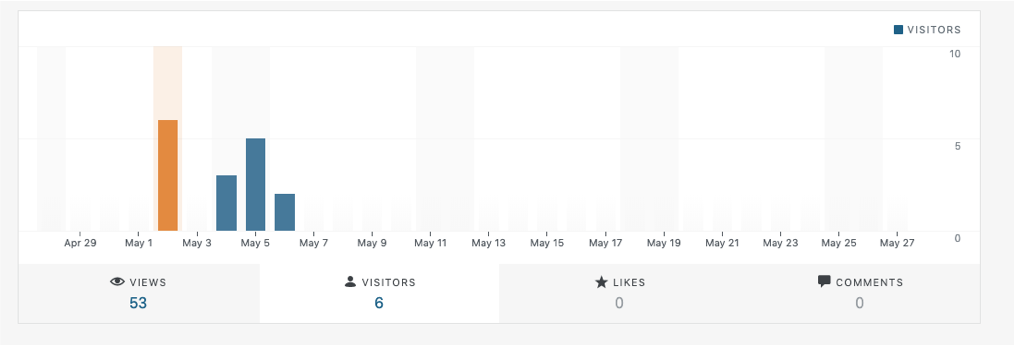
Although I had a lower impression count than I initially thought, the analytics above show a correlation between an Instagram post made on the 2nd of May and a spike in user impressions on my Word press site. It shows that on the 2nd of May when this post was made, my site got 53 extra views from an addition 6 viewers. This confirms the aforementioned method of advertising over social media; while also affirming the intended demographic of viewers.
The Future of ‘A Tour of South Australia’
With the current concept of ‘A Tour of South Australia’, providing upkeep is continued, this site has the potential to continue running indefinitely. Through exploration and possibly an expansion of the site and social media accounts; A Tour of South Australia can continue being updated as well as holding the potential to be altered slightly into a discussion and or submission paradigm. In terms of design, maybe adding a few more colours, rather than just having the minimalist colour theme. This could add more vibrancy to the sit as well as add another element to attract the viewers. Forward from this, I could develop this site to become multimodal; adding videos and possibly video-blogging the experience to share with the viewers. This will help the site become more three-dimensional, adding yet another layer to entice and attract viewers.
References
Berger, J 1972, ‘Understanding a Photograph’, Vol. N/A, Pp. 1/3, viewed on the 21May, 2019, <http://webcache.googleusercontent.com/search?q=cache:XEvDF7nZ2v8J:www.macobo.com/essays/epdf/berger_understanding_a_photograph.pdf+&cd=14&hl=en&ct=clnk&gl=au&client=firefox-b-d>
Lawrence, D. & Tavakol, Soheyla. author, 2007. Balanced Website Design Optimising Aesthetics, Usability and Purpose / by Dave Lawrence, Soheyla Tavakol., Pp. 239.
Hausman, AV & Siekpe, JS 2009, ‘The effect of web interface features on consumer online purchase intentions’, Journal of Business Research, vol. 62, no. 1, pp. 5-13, viewed 22 May 2019.
Cohen, J & Kenny, T 2015, ‘Producing new and digital media: your guide to savvy use of the web’, Taylor & Francis Group, London, Pp. 10, Vol. N/A.
Ebster, C; Poecze, F & Strauss, C 2018, ‘Social media metrics and sentiment analysis to evaluate the effectiveness of social media posts’, Procedia Computer Science, vol. 130, no. 1, pp.660-666, viewed 29 May 2018, <https://www.sciencedirect.com/science/article/pii/S1877050918304794?via%3Dihub>.
